Monitoring KubeEdge Edge Nodes with Prometheus
Environment Information
| Component | Version |
|---|---|
| containerd | 1.7.2 |
| k8s | 1.26.0 |
| KubeEdge | 1.17.0 |
| Jetson model type | NVIDIA Jetson Xavier NX (16GB ram) |
Regarding the KubeEdge version description:This feature is recommended for version 1.15.0 and above. Since v1.17.0 supports edge pods using InclusterConfig, the approach is different for versions before and after v1.17.0. This document will use v1.17.0 as examples to illustrate the steps,for versions prior to v1.17.0, please refer to the corresponding version documentation.
Deploying Prometheus
We can quickly install using the Helm Charts of kube-prometheus, or we can install it manually.
It is important to pay attention to the compatibility between the Kubernetes version and kube-prometheus.
git clone https://github.com/prometheus-operator/kube-prometheus.git
cd kube-prometheus
kubectl apply --server-side -f manifests/setup
kubectl wait \
    --for condition=Established \
    --all CustomResourceDefinition \
    --namespace=monitoring
kubectl apply -f manifests/
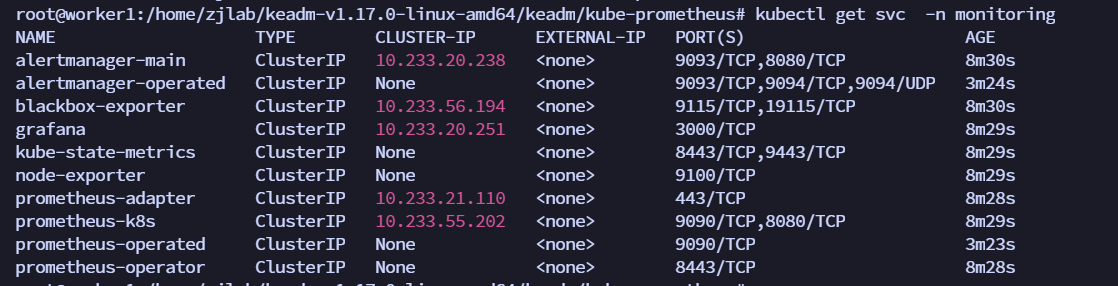
You can see that a ClusterIP type Service has been created for grafana, alertmanager, and prometheus. Of course, if we want to access these two services from the Internet, we can create the corresponding Ingress objects or use NodePort type Services. Here, for simplicity, we directly use NodePort type services. Edit the 3 Services of grafana, alertmanager-main, and prometheus-k8s to change the service type to NodePort:
kubectl edit svc grafana -n monitoring
kubectl edit svc alertmanager-main -n monitoring
kubectl edit svc prometheus-k8s -n monitoring
Due to the latest version of kube-prometheus setting NetworkPolicy, even if NodePort is configured, access is not possible. You need to modify the NetworkPolicy to allow access from the 10 network segment IP.
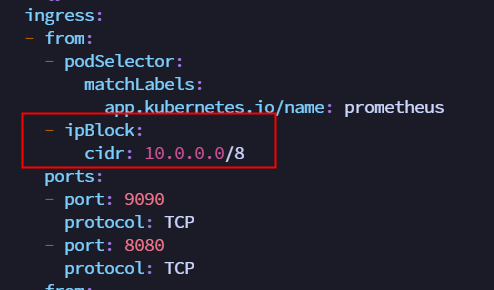
kubectl edit  NetworkPolicy prometheus-k8s -n monitoring
kubectl edit  NetworkPolicy grafana -n monitoring
kubectl edit  NetworkPolicy alertmanager-main -n monitoring
Now you can access the prometheus and grafana services via NodePort.
Deploying KubeEdge
Enable the InClusterConfig feature
When deploying version 1.17.0, pay attention that it is necessary to support edge Pods to use InClusterConfig to access Kube-APIServer, so you need to configure the specified cloudCore.featureGates.requireAuthorization=true and cloudCore.modules.dynamicController.enable=true. Details can be found in the KubeEdge public account article
keadm init --advertise-address=10.108.96.24 --set cloudCore.featureGates.requireAuthorization=true,cloudCore.modules.dynamicController.enable=true --kubeedge-version=v1.17.0
After starting EdgeCore, modify the edgecore.yaml and restart EdgeCore as follows.
Modify metaServer.enable = true and add featureGates: requireAuthorization: true
apiVersion: edgecore.config.kubeedge.io/v1alpha2
kind: EdgeCore
featureGates:
  requireAuthorization: true
modules:
  ...
  metaManager:
    metaServer:
      enable: true
After modification, restart edgecore
systemctl daemon-reload
systemctl restart edgecore
Create clusterrolebinding
It was found that the container inside node-exporter reported an error: Unable to authenticate the request due to an error: tokenreviews.authentication.k8s.io is forbidden: User "system:serviceaccount:kubeedge:cloudcore" cannot create resource "tokenreviews" in API group "authentication.k8s.io" at the cluster scope.
Because cloudcore does not have permission, create a clusterrolebinding.

kubectl create clusterrolebinding cloudcore-promethus-binding --clusterrole=cluster-admin --serviceaccount=kubeedge:cloudcore
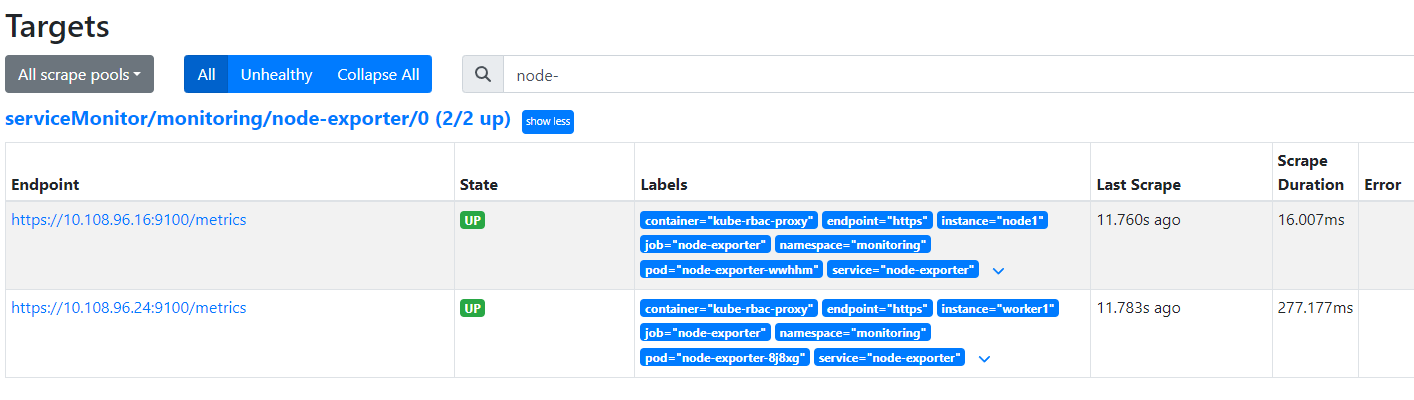
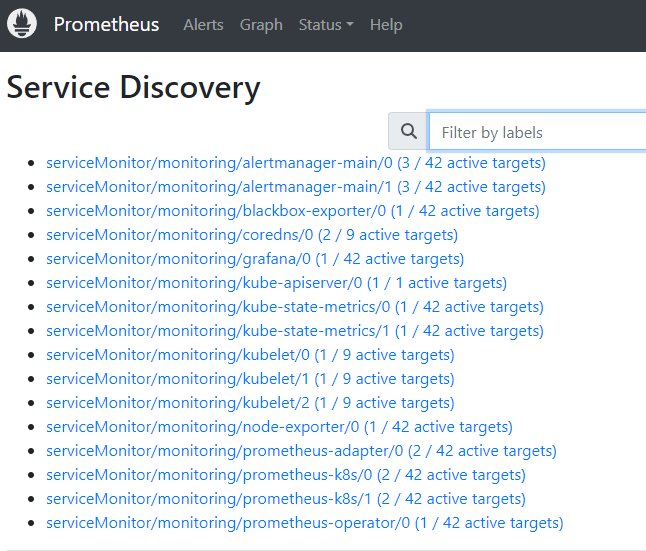
After creating the clusterrolebinding, you can query the monitoring information of the edge nodes.